How the UK Housing Market Works
The UK housing market is one of the most closely watched parts of the national economy, yet it is also one of the most widely misunderstood. Headlines announce that prices are rising or falling, often in the same week, using figures that do not agree with one another. Behind those headlines sits a complex system of buyers and sellers, lenders, estate agents, conveyancers, housebuilders, local authorities and government policy, all interacting to determine who owns property, who rents it, and what it costs. This guide explains how that system actually works: how prices are measured, what moves them, how a property purchase progresses from offer to completion, what buying really costs, how new homes are added to the stock, and why home ownership has been falling even as the market expands in value.
What is the UK housing market?
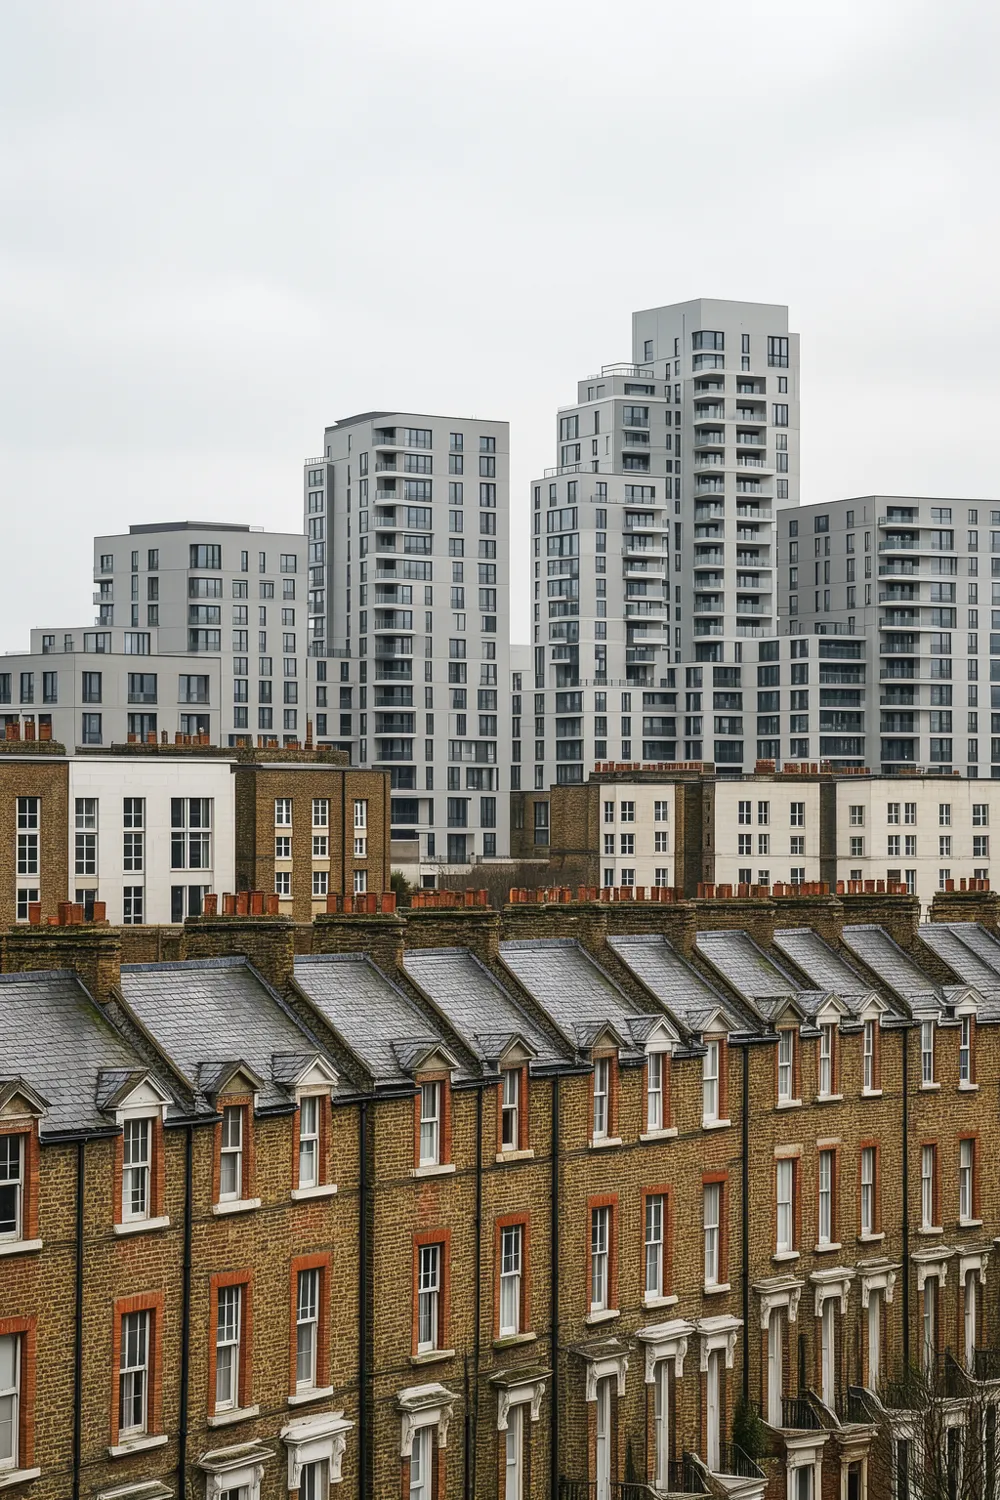
The UK housing market is the system through which residential property is bought, sold, rented and financed. It is not a single market but a collection of overlapping local markets that behave very differently from one another, connected by national factors such as interest rates, lending rules and government policy. A flat in central London, a terraced house in Bristol and a new-build estate in the North East are all part of the same statistical picture, but they respond to different pressures and often move in opposite directions at the same time.
At its centre are households and the form of tenure under which they live. According to the English Housing Survey for 2024-25, owner occupation remains the largest tenure group at 65 per cent of households in England, or roughly 16.2 million homes. The private rented sector accounts for 19 per cent, around 4.7 million households, while the social rented sector makes up 16 per cent. These proportions matter because they shape demand: a market in which fewer people can buy pushes more households into renting, which in turn affects rents, investment in buy-to-let property, and the political pressure that drives housing policy.
Several distinct groups keep the market moving. Buyers and sellers make the decisions and provide the money. Estate agents market properties and negotiate offers. Mortgage lenders and brokers arrange the finance that funds the overwhelming majority of purchases. Solicitors and licensed conveyancers carry out the legal transfer of ownership. Surveyors assess the condition and value of properties. Housebuilders and developers add new supply, while local authorities control planning permission and maintain records that feed into the system. HM Land Registry holds the official record of who owns what. Each of these actors can speed up, slow down or block a transaction, which is why the market often feels sluggish even when demand is strong.
Understanding the housing market also means understanding its place in the wider economy. Property is the largest single store of household wealth in the UK, and changes in house prices ripple through consumer confidence, spending and the financial system. That connection runs in both directions, which is why housing cannot be understood in isolation from how the UK economy works as a whole.
How are UK house prices actually measured?
There is no single official figure for the price of a UK home. Instead, several organisations publish their own house price indices, each using a different method, a different sample and a different point in the buying process. This is the single biggest source of confusion in housing coverage, because the indices regularly report different average prices and even point in different directions in the same month. None of them is simply wrong; they are measuring different things.
The most authoritative measure is the UK House Price Index, produced by HM Land Registry and the Office for National Statistics. It is based on completed sales recorded at the Land Registry, which makes it the most comprehensive measure, but also the slowest: because a purchase typically takes six to eight weeks to complete and then has to be registered, the figures run on roughly a two-month lag. In the year to April 2026 it put the average UK property at £270,000, an annual increase of 3.8 per cent. The lenders’ indices, by contrast, are faster but narrower. Nationwide and Halifax base their figures on their own mortgage approvals, so they capture the agreed price weeks before completion but exclude cash buyers entirely. Nationwide put the average price at around £278,000 in spring 2026.
The portals measure something different again. Rightmove tracks asking prices, the figure sellers hope to achieve rather than what buyers actually pay, which is why its average is consistently the highest of all, sitting around £368,000 in early 2026. Zoopla blends sold prices, mortgage valuations and agreed sales to estimate current values, landing near £271,900. The table below sets out what each index actually captures, which explains why they so rarely agree.
| Index | Based on | Stage measured | Approx. average (early 2026) |
|---|---|---|---|
| UK House Price Index (HM Land Registry / ONS) | Completed sales, all buyers including cash | Completion (≈2-month lag) | £270,000 |
| Nationwide | Own mortgage approvals | Mortgage approval | £278,000 |
| Halifax | Own mortgage approvals | Mortgage approval | Near flat year-on-year |
| Zoopla | Sold prices, valuations, agreed sales | Blended estimate | £271,900 |
| Rightmove | Asking prices set by sellers | Listing (before any sale) | £368,000 |
For anyone trying to read the market, the practical lesson is to match the index to the question. To understand what homes are selling for, the Land Registry figure is the most reliable, even though it is the oldest. To gauge momentum right now, the lenders’ indices react faster. To see how confident sellers feel, asking prices reveal expectations. Reading any one figure in isolation, or comparing an asking-price headline against a completed-sales figure, is how the same market ends up being described as both rising and falling in the same week.
Regional variation compounds the picture. In the year to April 2026 the strongest growth was in the North East, where prices rose by 9.9 per cent, while London fell by 2.1 per cent to an average of £553,000. A single national average can therefore conceal markets moving in completely opposite directions, which is why local data matters far more to an individual buyer than the headline national rate.
What drives house prices up and down?
House prices are set by the balance between demand and supply, but in the short term the most powerful lever is the cost of borrowing. Because most purchases are financed with a mortgage, the price a buyer can offer depends less on the headline price of a home than on the monthly repayment they can afford. When mortgage rates rise, the same monthly budget buys a smaller loan, which reduces what buyers can bid and puts downward pressure on prices. When rates fall, borrowing power expands and prices tend to firm.
Mortgage rates are shaped by the Bank of England’s Bank Rate and by the swap rates that lenders use to price fixed deals. In early 2026 the Bank held its rate at 3.75 per cent, and average fixed mortgage rates sat at roughly 5.6 per cent for both two-year and five-year deals. Those rates had been expected to fall further through the year, but renewed conflict in the Middle East pushed up energy prices and inflation expectations, leading lenders to raise rates in spring 2026 rather than cut them. This is a clear illustration of how housing is exposed to events far beyond the property market, and of why the direction of interest rates and monetary policy is the variable that buyers and sellers watch most closely.
Beyond borrowing costs, several other forces shape prices. Household incomes matter because affordability is ultimately a relationship between prices and wages; when earnings grow faster than prices, as they did through 2025 and into 2026, affordability slowly improves even if prices are flat. The supply of homes for sale affects the balance of power: Zoopla reported that the average estate agent began 2026 with 32 homes on their books, the highest level at the start of a year for eight years, which gave buyers more choice and kept price growth in check. Confidence and expectations play a role too, as buyers who expect prices to rise are willing to stretch, while uncertainty makes them cautious. Finally, government policy, from stamp duty thresholds to lending regulation, can accelerate or cool the market, as the rush of transactions before the April 2025 stamp duty changes demonstrated.
The interaction of these forces explains why forecasters expected only modest movement in 2026. Most major lenders and analysts predicted low single-digit growth of around 2 per cent, with the Office for Budget Responsibility expecting transactions to recover slowly rather than return to the conditions of the early 2020s. The recurring theme is differentiation: a market no longer moving as one, in which family homes in affordable areas hold their value while flats, leasehold properties and homes with cladding or short leases behave very differently. This wider context is part of inflation and the cost of living, which determines how much room households have to spend on housing in the first place.
How does buying a house actually work?
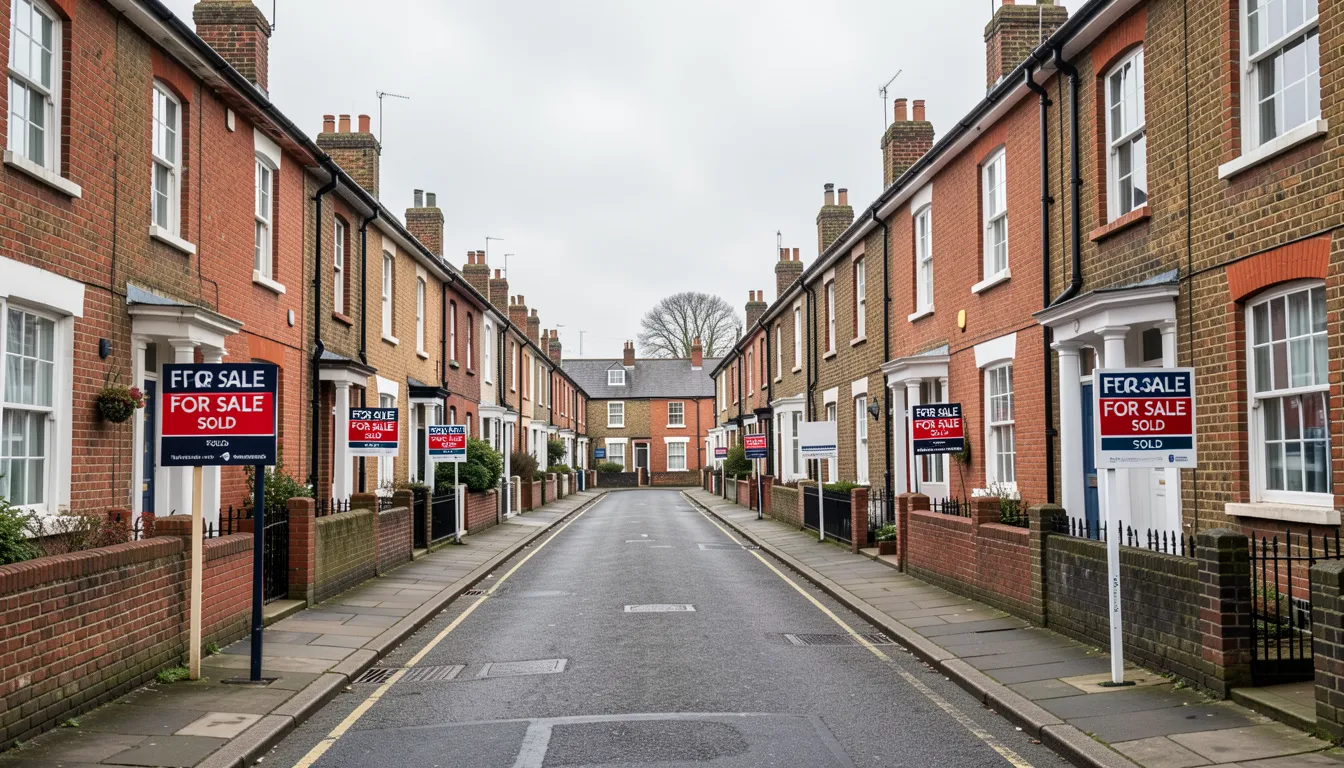
Buying a home in the UK follows a recognisable sequence, but it is rarely as smooth as the steps suggest, because each stage depends on third parties whose pace cannot be controlled. The process begins before any property is found, with the buyer establishing how much a lender will offer. A decision in principle, sometimes called an agreement in principle, is a soft credit check that confirms roughly what a lender would lend; estate agents take offers more seriously when a buyer has one in hand.
Once an offer is accepted, the legal process known as conveyancing begins. The buyer instructs a solicitor or licensed conveyancer, who carries out searches with the local authority and other bodies to check for issues such as planning restrictions, flood risk and rights of access. The seller’s solicitor provides a draft contract and property information. The buyer’s side raises enquiries, the mortgage lender carries out a valuation to confirm the property is worth the loan, and a survey assesses its condition. Searches alone can take anywhere from ten to twenty-five working days, and this pre-exchange stage is usually the longest part of the process.
The transaction becomes legally binding only at exchange of contracts, when the buyer pays a deposit, typically five to ten per cent of the price, and a completion date is fixed. Until that moment, either party can walk away without legal penalty, which is the root of two practices that frustrate buyers: gazumping, when a seller accepts a higher offer from someone else after already accepting yours, and gazundering, when a buyer reduces their offer at the last minute. Completion follows on the agreed date, when the balance of the money is transferred, ownership changes hands and the keys are released. After completion the solicitor pays any stamp duty within fourteen days and registers the new owner with HM Land Registry.
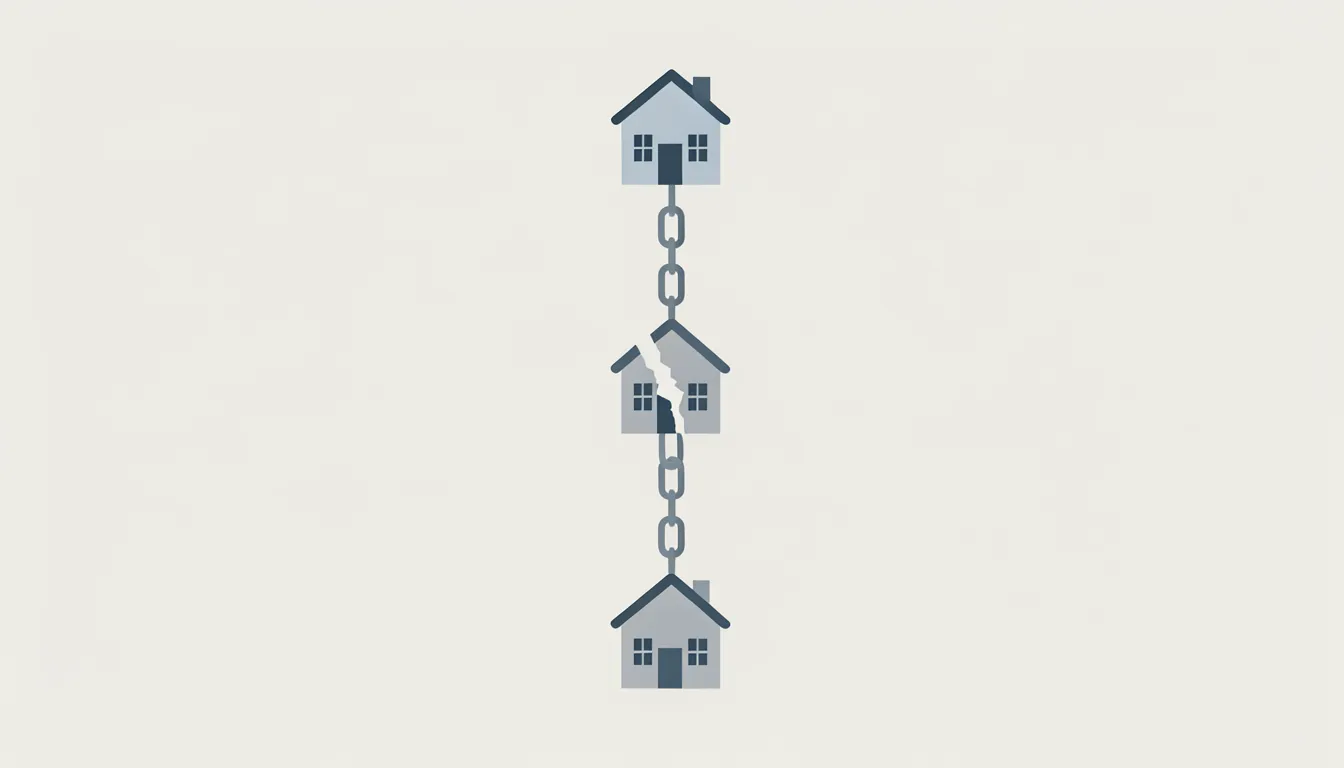
A straightforward purchase by a first-time buyer with no chain can complete in six to eight weeks, but most transactions take longer. A typical sale and purchase runs to twelve to sixteen weeks, and long chains of five or more linked transactions can stretch to twenty weeks or more. The chain is the single greatest source of delay and collapse. Because most sellers are also buyers, transactions link together, and the whole chain can only move at the pace of its slowest link. If any one party pulls out or cannot proceed, every linked sale above and below can fall through, leaving buyers and sellers to lose money already spent on searches, surveys and mortgage fees, which can run into thousands of pounds.
What does it really cost to buy a home?
The price of a property is only part of what a buyer needs. The deposit is the largest single cost, and the proportion matters as much as the amount. Most lenders accept a minimum deposit of 5 per cent, but 10 to 15 per cent is considered standard, and 25 per cent or more unlocks the lowest interest rates. On the average UK property of roughly £285,000, a 5 per cent deposit is £14,250 and a 10 per cent deposit is £28,500. The size of the deposit determines the loan-to-value ratio, which lenders use to price the mortgage: the lower the ratio, the lower the perceived risk and the better the rate offered.
On top of the deposit sit several other costs that cannot be added to the mortgage. Stamp Duty Land Tax is the most significant for many buyers. Since the temporary thresholds expired on 1 April 2025, standard buyers in England and Northern Ireland pay nothing on the first £125,000 of a purchase, then rising rates above that. First-time buyers pay no stamp duty on the first £300,000 of a property worth up to £500,000, and 5 per cent on the portion between £300,000 and £500,000; above £500,000 the relief disappears entirely. Scotland and Wales operate their own systems, Land and Buildings Transaction Tax and Land Transaction Tax respectively, with different thresholds. The table below shows the typical additional costs a buyer should budget for, separate from the deposit.
| Cost | Typical range | Notes |
|---|---|---|
| Conveyancing / legal fees | £1,000–£2,000 | Plus search fees and disbursements |
| Mortgage arrangement fee | £1,000–£2,000 | Sometimes added to the loan |
| Mortgage booking fee | £100–£200 | Non-refundable if the purchase falls through |
| Property survey | £400–£1,500 | Condition report to full building survey |
| Removals | £150–£2,000+ | Depends on distance and volume |
| Land Registry registration | £250–£500 | Varies with property price |
| Stamp Duty Land Tax | £0–12% of price | Depends on price and buyer status |
A useful rule of thumb is to budget around 15 per cent of the property’s value to cover all the upfront costs beyond the purchase price itself. For a typical first home, the additional costs above the deposit commonly fall between £4,000 and £8,000 even when no stamp duty is due. These are the figures that turn an apparently affordable headline price into a much larger savings target, and they are the reason that the deposit is rarely the only obstacle.
From the vantage point of someone renting a terraced house in Bristol and watching the market from the outside, the arithmetic is sobering. A Lifetime ISA, which adds a 25 per cent government bonus on up to £4,000 saved each year, helps, but the bonus is capped and the home must cost no more than £450,000. Saving a 10 per cent deposit on a modest Bristol house while paying rent that has itself risen year after year is the central squeeze facing a generation of would-be buyers, and it explains why the gap between renters and owners has widened even as the market has grown in value. Watching asking prices on the portals drift upward while a deposit fund inches forward is a familiar experience, and it is the practical reality behind the affordability statistics.
How is new housing supply added?
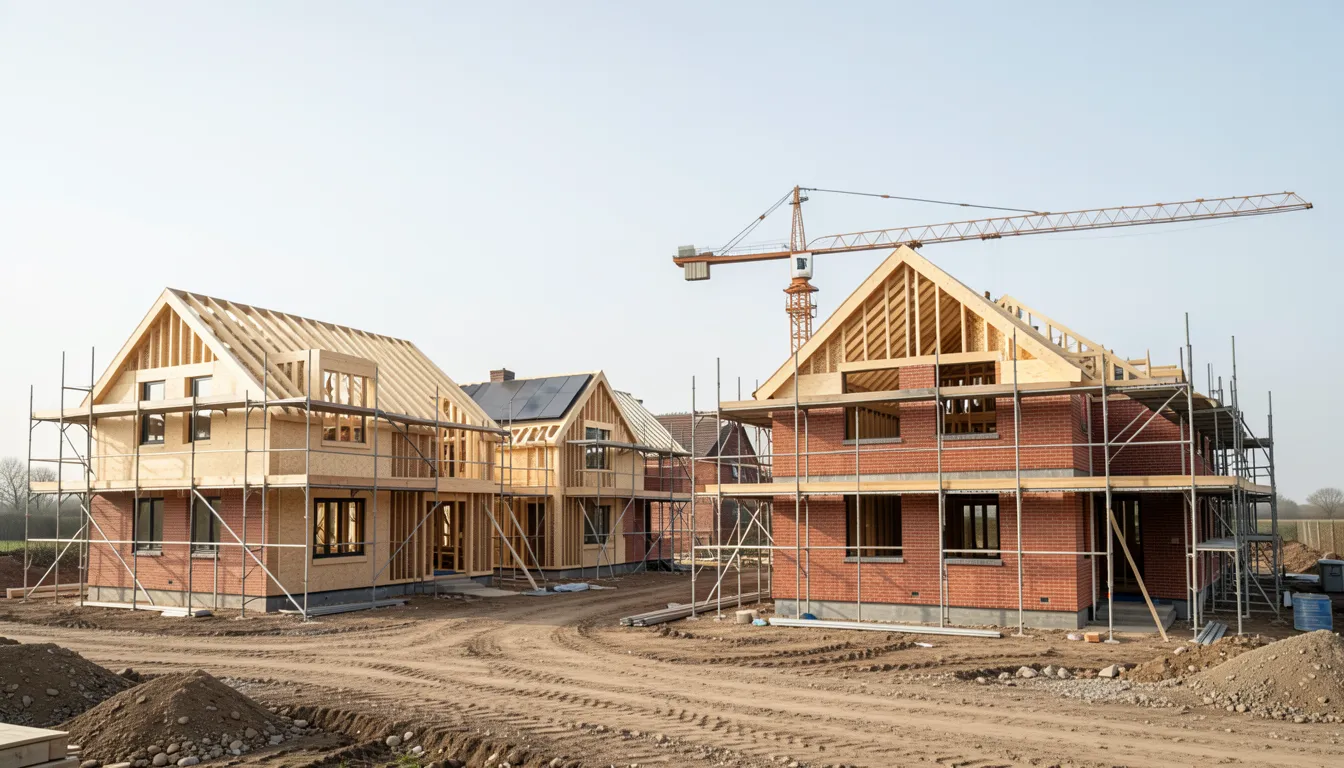
New homes are added to the stock far more slowly than demand grows, and this long-running shortfall is the structural force underlying high prices. The most comprehensive measure of supply is net additional dwellings, published by the Ministry of Housing, Communities and Local Government. In 2024-25 England gained 208,600 net additional dwellings, a 6 per cent fall on the previous year and the third consecutive annual decline. To put that in context, it represents an increase of just 0.81 per cent on the existing stock of around 25.6 million dwellings.
Most of that supply comes from new construction. Of the 2024-25 total, new build completions accounted for 91 per cent, with the remainder coming from converting larger buildings into flats, changing the use of commercial premises into homes, and other minor gains, offset by demolitions. The official net additional dwellings statistics show that private enterprise delivered an estimated 71 per cent of new build homes, housing associations 25 per cent and local authorities just 4 per cent. The near-disappearance of council housebuilding, which once added hundreds of thousands of homes a year, is one of the defining shifts in the post-war housing story.
Supply is constrained at several points. The planning system, controlled by local authorities, determines where and what can be built, and the time taken to secure permission is a frequent source of delay. Private developers, which now build most new homes, have a commercial interest in releasing houses at a pace that protects prices rather than flooding the market, a practice critics call build-out rate management. The availability of land, the cost of materials and labour, and building regulations all add further friction. The government has set a target of delivering 1.5 million homes over the current parliament, but with annual net additions falling rather than rising, that target looks increasingly demanding. How these competing pressures are balanced is ultimately decided through how UK government policy is made, which shapes planning rules, funding and housing targets.
Why is home ownership falling?
Home ownership in England peaked at 71 per cent of households in 2003 and has since fallen to around 65 per cent, with the steepest decline occurring after the financial crisis of the late 2000s, reaching a low of 63 per cent in 2013-14 before stabilising. The headline reason is affordability. The typical first-time buyer property now costs around 5.9 times the average salary, a ratio that has placed ownership out of reach for many households, particularly younger ones, who would once have expected to buy in their twenties or early thirties.
The decline is best understood as the product of several long-term forces acting together. House prices have risen faster than wages over decades, so the deposit required has grown far beyond what most people can save from income alone. The Housing Act 1980 introduced the Right to Buy, which helped millions of council tenants become owners but reduced the social housing stock, much of which was never replaced. Population growth has added demand while construction has lagged behind. Tighter lending rules introduced after the financial crisis, designed to prevent reckless borrowing, also made it harder to obtain a large mortgage with a small deposit. Together these forces have produced a market in which owning is increasingly determined by family wealth, as parental gifted deposits become a routine part of getting onto the ladder.
The consequences extend well beyond individual frustration. As ownership has fallen, the private rented sector has roughly doubled in size since the early 2000s to around 19 per cent of households, concentrating a growing share of the population in a tenure that offers less security and, over a lifetime, often higher costs. This shift has made housing one of the most politically charged issues in the country and a recurring theme in UK news, from debates over planning reform to the regulation of landlords.
How do renting and the housing market connect?
Renting and buying are often treated as separate worlds, but they are two sides of the same market. When ownership becomes harder, demand for rented homes rises, pushing up rents; higher rents in turn make it harder for tenants to save a deposit, which keeps them renting for longer. This feedback loop is central to understanding why the housing market affects everyone, not only those trying to buy.
The numbers show the pressure clearly. The Office for National Statistics reported that average UK private rents rose by 3.5 per cent in the year to January 2026, taking the average monthly rent to £1,367. The regional pattern was striking: rental inflation was highest in the North East at 8 per cent and lowest in London at 1.1 per cent, partly because London rents had already risen so far that they reached a ceiling of affordability. For a tenant, a rent rise of even a few per cent can absorb the very money that might otherwise have gone towards a deposit, which is why renting and the difficulty of buying are so tightly linked.
The private rented sector is also shaped by the same forces that drive the sales market. When mortgage rates rise, some landlords sell up or pass higher costs on through rents; when house prices stall, buy-to-let becomes less attractive as an investment, reducing the supply of rental homes. The structural undersupply of housing affects both markets at once, which is why no analysis of the housing market is complete without considering tenure as a whole. Future guides in this cluster will examine renting, tenant rights, the planning system and social housing in greater depth.
UK Housing Market: Frequently Asked Questions
How much deposit do I need to buy a house in the UK?
Most lenders accept a minimum deposit of 5 per cent of the property price, but 10 to 15 per cent is considered standard and 25 per cent or more unlocks the lowest interest rates. On the average UK property of around £285,000, a 5 per cent deposit is £14,250 and a 10 per cent deposit is £28,500. The deposit also sets your loan-to-value ratio, which lenders use to price the mortgage.
Why do UK house price indexes show different figures?
Each index measures a different stage of the buying process. The UK House Price Index from HM Land Registry uses completed sales and runs on a two-month lag. Nationwide and Halifax use their own mortgage approvals and exclude cash buyers. Rightmove tracks asking prices set by sellers, which is why its average is the highest. Zoopla blends sold prices, valuations and agreed sales. None is wrong; they capture different moments.
How long does it take to buy a house in the UK?
A first-time buyer with no chain can complete in six to eight weeks. A typical sale and purchase takes twelve to sixteen weeks, and a long chain of five or more linked transactions can stretch to twenty weeks or more. The pre-exchange stage, including local authority searches that can take ten to twenty-five working days, is usually the longest part.
What is a property chain and why do sales fall through?
A property chain is a sequence of linked transactions in which most sellers are also buyers. The chain can only move at the pace of its slowest link. If any one party pulls out or cannot proceed, every linked sale above and below can collapse, and buyers and sellers may lose money already spent on searches, surveys and mortgage fees.
How much stamp duty do first-time buyers pay?
In England and Northern Ireland, first-time buyers pay no Stamp Duty Land Tax on the first £300,000 of a property worth up to £500,000, and 5 per cent on the portion between £300,000 and £500,000. Above £500,000 the relief does not apply and standard rates start at £125,000. Scotland and Wales use their own separate systems.
Why is home ownership falling in the UK?
Home ownership in England peaked at 71 per cent of households in 2003 and has fallen to around 65 per cent. The main driver is affordability: the typical first-time buyer property now costs around 5.9 times the average salary. House prices rising faster than wages, a reduced social housing stock, population growth outpacing construction and tighter lending rules have together made buying harder, increasingly dependent on family wealth.
Related guides
- How the UK Economy Works
- UK Interest Rates and Monetary Policy Explained
- UK Inflation and Cost of Living Explained
- How UK Government Policy Is Made